...
| 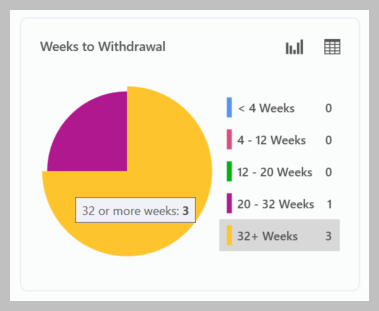 |
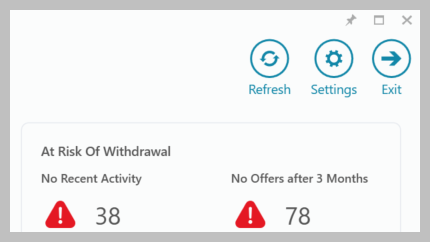
At Risk of Withdrawal
 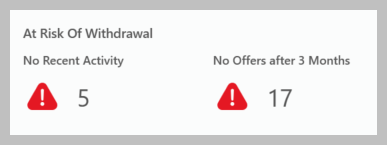 No Recent Activity
No Offers after 3 months
|
...
Accessing Settings
|  |
Settings options All Settings options are shown below  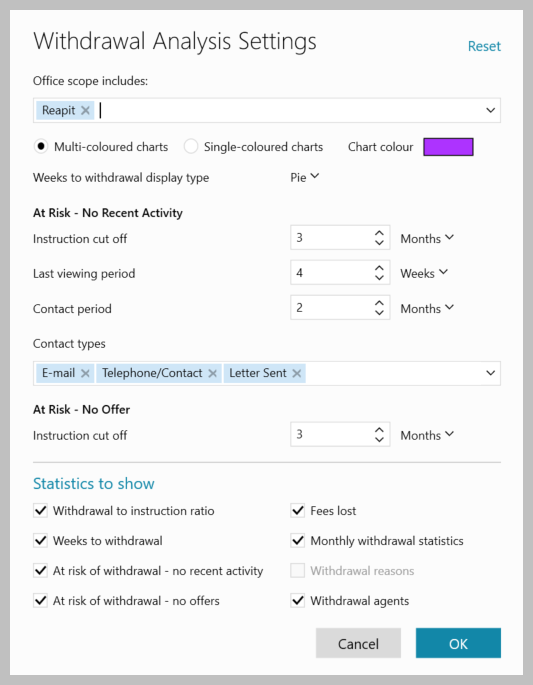
| |
...
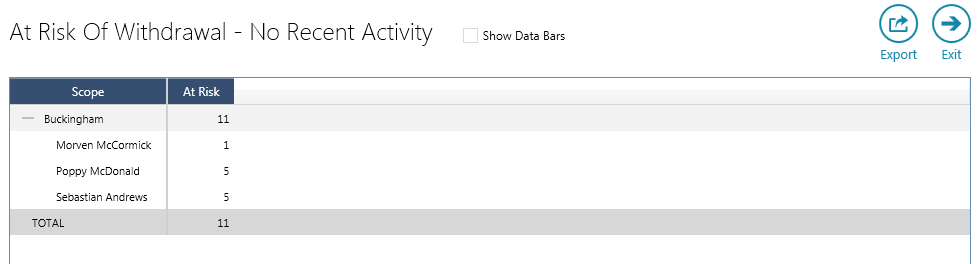
Viewing data grids Data grids are available to allow you to drill down to view the data behind the chart/statistic
|
Data grid features
|
Show data bars
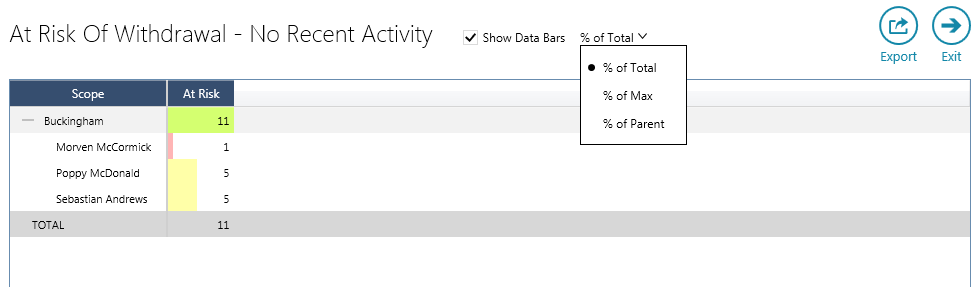
|
Related articles
| Filter by label (Content by label) | ||||||||||||||||||
|---|---|---|---|---|---|---|---|---|---|---|---|---|---|---|---|---|---|---|
|
...