...
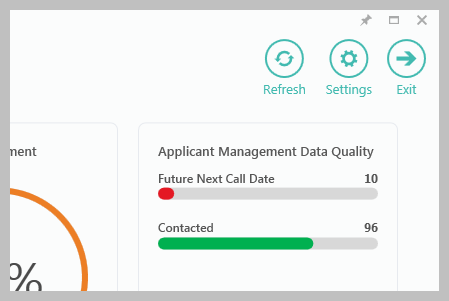
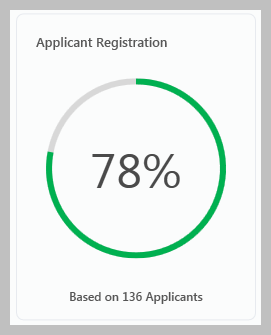
The Data Accuracy Analysis dashboard, one of the Management Information (MI) real-time dashboards available in AgencyCloud, focuses on the accuracy of applicant and property data entered in your database. It is a great tool for ensuring that your users are entering /updating data accurately.
This real-time dashboard will help you to easily pinpoint problem areas in your data and take quick action, resulting in a more reliable database, long term
...
Accessing Settings
|  | |||||
Settings options All Settings options are shown below 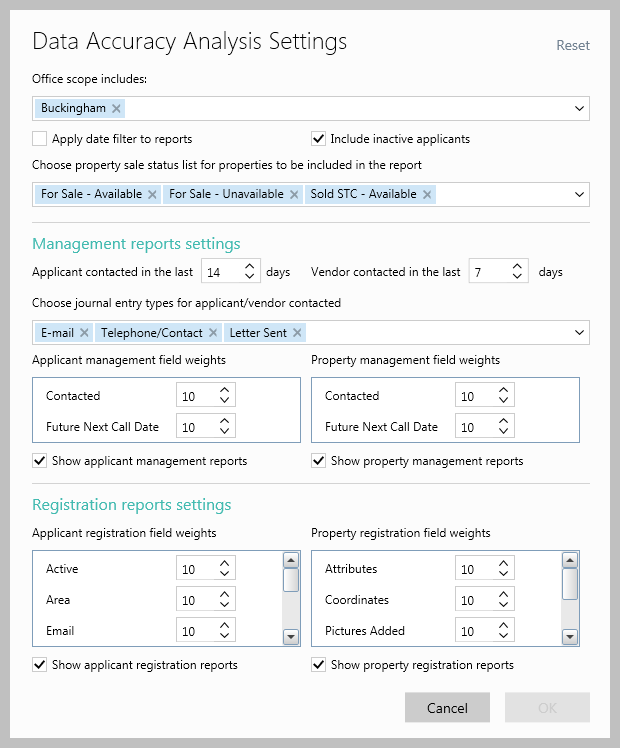 Office scope includes
Apply date filter to reports
Include inactive applicants
Choose property sale status…
Management reports settings
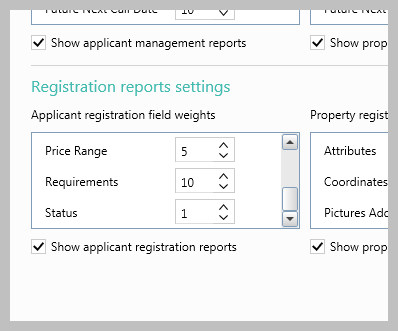
Registration reports settings
| ||||||

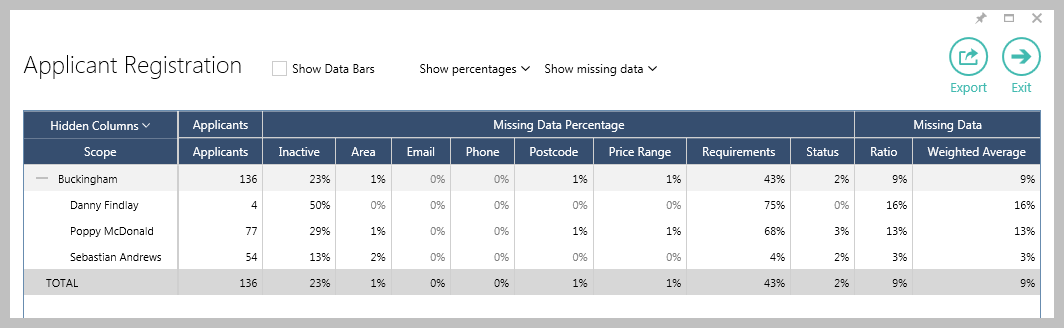

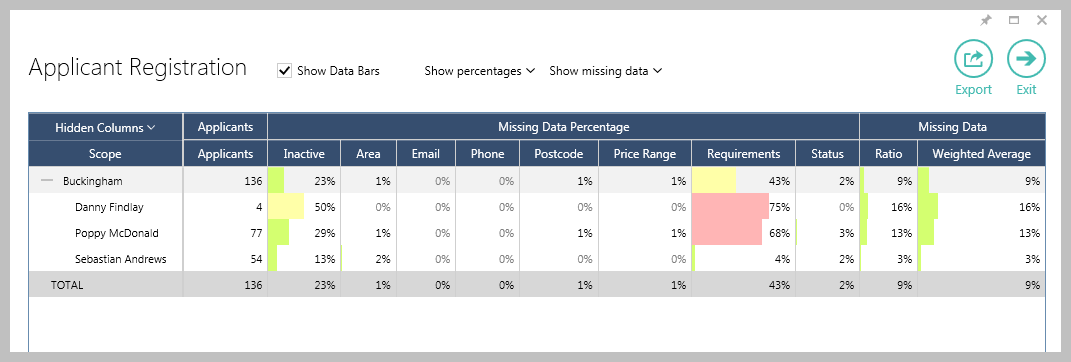
Data grids
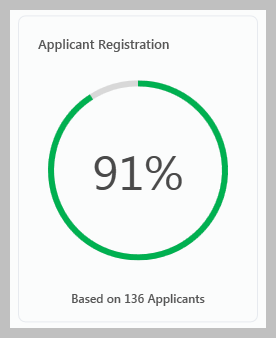
Viewing data grids Data grids are available to allow you to drill down to view the data behind the chart/statistic
|
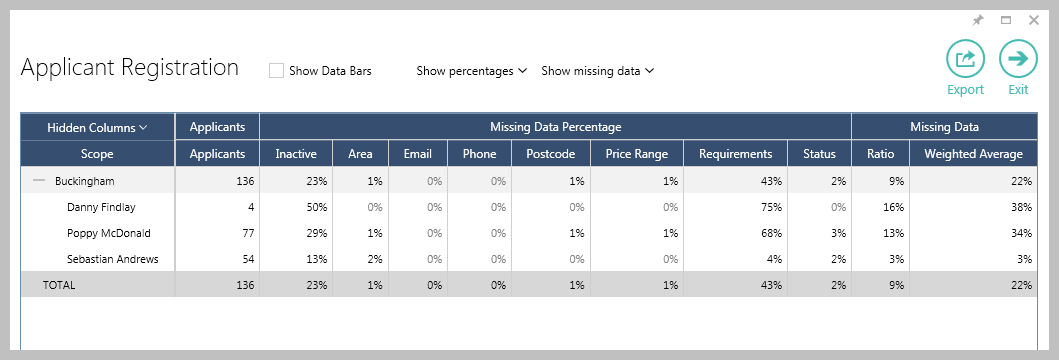
Data grid features
|
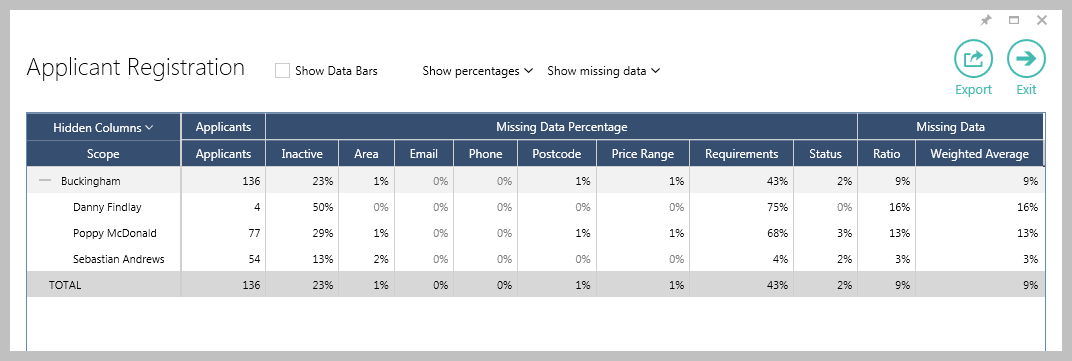
Show data bars
|
...